(Direct Factory vs Agent vs Trading Company)
Most garment sourcing decisions start and end with one number: FOB price. Then the surprises arrive — sampling overages, compliance testing fees, rework charges, packaging add-ons, bank fees, and delayed shipments that quietly destroy your margin.
If your brand is still negotiating on FOB alone, you’re optimizing the wrong number. Total Cost of Ownership (TCO) — not unit price — determines real margin and supply chain reliability.
This guide introduces a complete framework for a Sourcing Cost Calculator that compares three garment sourcing models side by side: direct factory, agent-based, and trading company. With the right model, international brands can unlock up to 40% savings on cotton knitwear programs — especially when switching from opaque trading-company structures to transparent direct-factory partnerships in Tirupur, India.
Rudraa Exports operates as a direct-factory partner inside the Tirupur knitwear cluster — the global hub that accounts for a major share of India’s cotton knit exports and continues to grow under China-plus-one diversification strategies.
Quick Answer: How Much Can You Save by Switching from Agent to Direct-Factory Sourcing?
International brands can save 20–40% on garment manufacturing costs by switching from trading-company or agent-based sourcing to a direct-factory model. The savings come from three sources: eliminating intermediary markups (trading companies typically add 15–40%, agents charge 3–7% commission), reducing hidden costs (sampling, testing, packaging, rework, bank fees), and improving cost transparency through line-item visibility. A 100,000-piece annual T-shirt program with a 25% trading markup can save approximately $65,000 per year on FOB alone before factoring in eliminated hidden costs.
Understanding the Garment Cost Stack: Why FOB Alone Misleads Buyers
Garment costs are best understood as a stack, not a single number. Even when two quotes look close, the structure of the sourcing relationship determines where costs hide — and whether you can audit or prevent them.
Two realities shape your final landed cost:
- FOB is not the whole story. Procurement research consistently shows FOB represents only part of true end-to-end cost once logistics, quality risk, compliance, and finance charges are added.
- Intermediaries change the economics. Agents typically charge 3–7% commission, while trading companies often embed 15–40% markup into pricing — making it impossible to isolate true factory cost.
That spread alone can shift your cost baseline by double-digit percentages before a single hidden cost surfaces.
Pricing Model Comparison Table
| Cost Element | Direct Factory | Agent Model | Trading Company |
|---|---|---|---|
| Base FOB | Factory cost + agreed margin | Factory cost + commission | Factory cost + embedded markup |
| Intermediary fees | None | 3–7% commission | 15–40% markup |
| Mill/fabric cost visibility | High (line-item) | Medium | Low to Medium |
| Risk of late-stage “extras” | Lower (pre-agreed TCO) | Medium | Higher (bundled late) |
| Best fit | Brands wanting transparency + control | Brands needing coordination | Brands prioritizing convenience |
Knitwear Benchmark Pricing (Tirupur, India)
Use these FOB ranges as sanity-check anchors when reviewing quotes:
- Cotton T-shirts (Tirupur): $1.50–$4.00 depending on fabric, print method, and volume
- Hoodies (India): $8–$18 depending on GSM, trims, branding complexity, and order size
If a quote sits far outside these bands, flag a specification mismatch (fabric GSM, print count, trim quality) before assuming it’s a deal.
The 5 Variables That Move Your Garment Cost the Most
Your sourcing calculator must capture these five variables to deliver a fair comparison:
1. Fabric and GSM composition — For knits, fabric is consistently the biggest cost driver. Tirupur cost breakdowns show fabric and materials as the dominant component.
2. Print or embroidery technique — Screen printing vs DTG vs embroidery changes labor minutes, consumable costs, and rejection risk.
3. Order volume — Higher volume spreads fixed sampling, pattern, and overhead costs. Lower volume increases per-unit overhead allocation.
4. Compliance and testing scope — Certifications and test plans shift from “nice-to-have” to mandatory depending on retailer and destination market.
5. Rework and claim rate — Even a 2–5% quality failure rate can erase the apparent savings from a “cheaper” quote.
How the Sourcing Cost Calculator Works (and What It Really Measures)
The goal of a sourcing calculator is not to pick the lowest quote. It’s to quantify three things accurately:
- Total landed cost difference between sourcing models
- Total Cost of Ownership (TCO) including predictable hidden costs
- ROI of switching models measured as annual savings versus switching costs
Required Inputs for Decision-Grade Comparison
A) Order and product details
- Product type (T-shirt, hoodie, polo, etc.)
- Annual units or per-order volume
- Style complexity (basic, moderate, complex)
B) Pricing structure inputs
- Factory FOB quote or benchmark estimate
- Agent commission percentage (typical 3–7%)
- Trading markup percentage (typical 15–40%)
- Direct-factory service fee, if any
C) Hidden cost buckets These are the most commonly cited surprises in apparel sourcing. Your calculator should accept per-unit or per-order estimates for each:
- Sampling and development costs (amortized per unit)
- Compliance and testing (per order or per style)
- Packaging and labeling add-ons
- Freight and documentation (lane-specific)
- Rework, returns, and claims (expected value)
- Finance, bank, LC, and transfer fees
D) Timeline and working capital
- Lead time assumption (Tirupur integrated supply chains often deliver in ~20–30 days FOB)
- Payment terms (deposit, LC, net days)
Calculator Outputs That Actually Matter
Your output should display three layers of comparison:
- FOB comparison: Direct factory vs agent vs trading company
- Landed cost comparison: FOB + estimated logistics + documentation + testing
- TCO comparison: Landed cost + expected quality risk + management overhead + financing
Plus these decision metrics:
- Annual savings = units × per-unit cost delta
- ROI = (Annual savings – switching costs) / switching costs
- Payback period = switching costs / monthly savings
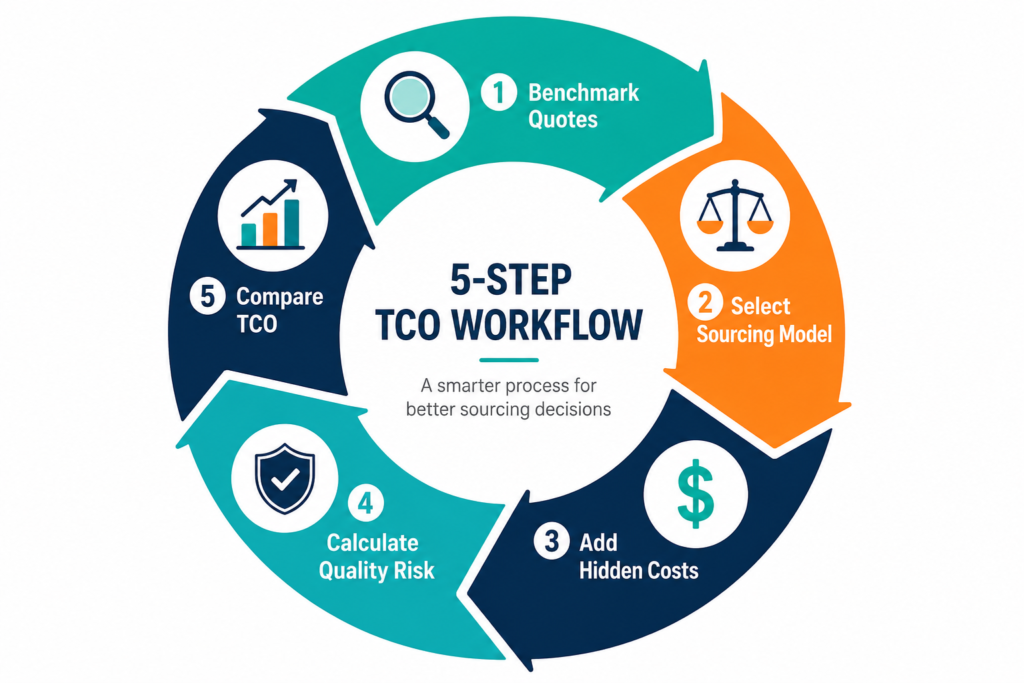
Step-by-Step Sourcing Calculator Workflow
Step 1 — Start with Benchmarks to Sanity-Check Quotes
For knit basics from Tirupur, use the observed FOB ranges as guardrails:
- T-shirts: $1.50–$4.00
- Hoodies: $8–$18
Quotes outside these ranges usually indicate spec mismatch, not better pricing.
Step 2 — Select Sourcing Model Scenarios
Run at least two parallel comparisons:
- Current state: Agent (commission model)
- Alternative: Direct factory (transparent cost + agreed margin)
- Optional third: Trading company (markup model)
Use published ranges as defaults: agent 3–7%, trading 15–40%.
Step 3 — Add Hidden Costs Explicitly
Build two presets:
- Optimistic preset: Conservative hidden cost assumptions
- Realistic preset: Industry-typical hidden cost levels
Run both so stakeholders see downside risk clearly.
Step 4 — Add Quality-Risk Expected Value
Even a small defect rate changes your effective unit cost dramatically. Use this formula:
Expected quality cost per unit = (Rework rate %) × (Cost impact per affected unit)
Step 5 — Compare TCO Over 12–24 Months
A long-term view captures repeat orders, learning curve gains, and fewer disruptions — exactly what supply chain resilience demands in 2026.
Two Real Sourcing Scenarios with Calculated Savings
Scenario 1: 100,000 Pieces Per Year — Basic Knit T-Shirt (EU Brand)
Product specifications: 180–200 GSM cotton jersey T-shirt with 1–2 color screen print Benchmark FOB range: $1.50–$4.00 Factory baseline FOB: $2.60
Model A — Agent-Based Sourcing
- Agent commission: 5% (within 3–7% range)
- Agent FOB = $2.60 × 1.05 = $2.73 per piece
Model B — Trading Company Structure
- Embedded markup: 25% (within 15–40% range)
- Trading FOB = $2.60 × 1.25 = $3.25 per piece
Model C — Direct Factory (Rudraa Exports approach)
- Direct FOB stays at baseline: $2.60 per piece
Per-unit savings analysis (trading vs direct):
- Per-unit gap: $0.65 (20% savings)
- Annual FOB-only savings on 100,000 pieces: $65,000 per year
When hidden costs (sampling, testing, packaging extras, rework coordination, bank fees) are also reduced through transparent direct-factory controls, effective savings can approach the upper end of the 40% range — particularly for long-running programs with repeat sampling and frequent change requests.
Scenario 2: 25,000 Pieces Per Year — Midweight Hoodie (US Brand)
Product specifications: 320 GSM fleece hoodie with embroidery and branded trims Benchmark FOB range: $8–$18 Factory baseline FOB: $12.00
Model A — Trading Company Structure
- Markup: 30% (within 15–40% range)
- Trading FOB = $12.00 × 1.30 = $15.60 per piece
Model B — Agent Commission Structure
- Commission: 7% (high end of range)
- Agent FOB = $12.00 × 1.07 = $12.84 per piece
Model C — Direct Factory (Rudraa Exports approach)
- Direct FOB at baseline: $12.00 per piece
Annual savings comparison:
| Comparison | Per-piece savings | Annual savings (25,000 pcs) |
|---|---|---|
| Trading vs Direct | $3.60 | $90,000/year |
| Agent vs Direct | $0.84 | $21,000/year |
This demonstrates why brands report the largest wins when replacing trading-company structures — because markup ranges are structurally larger than commission ranges.
For complex products like hoodies, jackets, and matching sets, configure your calculator to force line-item approval gates for trims, branding, and packaging. These are the most frequent sources of late-stage cost creep.
How to Avoid Hidden Costs in Garment Sourcing
The biggest cost surprises in apparel sourcing fall into seven categories:
1. Sampling and development overage — Each iteration can cost $50–$300 plus 2–6 weeks of lead time. Amortize this across order volume in your calculator.
2. Dyeing lot minimums — Custom colors require minimum dye batches. Buying below the minimum forces premium charges. Negotiate MOQs by fabric family (stock yarn shades versus custom) and phase volumes from pilot to repeat.
3. Packaging and labeling add-ons — Branded hangtags, woven labels, polybags, and master cartons are often quoted separately. Demand line-item pricing upfront.
4. Compliance and testing fees — Lab testing for chemical safety, fiber content, and physical performance can run $200–$800 per style depending on retailer requirements.
5. Freight and documentation — Container vs LCL, port-to-port vs door-to-door, and seasonal surcharges all change landed cost. Model these by lane and mode.
6. Rework, returns, and claims — Build an “expected quality cost” line into every comparison. A 3% defect rate on a $10 garment adds $0.30 per unit to true cost.
7. Bank, LC, and transfer fees — Often overlooked, but on a $250,000 order, bank charges of 0.5–1.5% mean $1,250–$3,750 in pure friction cost.
The Rudraa Exports approach: As a direct-factory partner in Tirupur, we provide line-item transparency on every cost bucket — fabric, trims, value-add, testing, packaging, freight — so brands negotiate against drivers, not final numbers.
Compliance Certifications and How They Affect TCO
A cost calculator is only useful if it reflects real production constraints — including compliance, environmental requirements, and buyer auditing. Tirupur is a mature export knitwear hub supporting extensive textile processing capacity across thousands of units in the cluster.
Here’s how key certifications affect your TCO model:
ISO 9001 (Quality Management Systems) — Standardizes processes and reduces variation, directly lowering defect risk, rework, and chargebacks. Shows up as a lower “expected quality cost” line in your calculator.
ISO 14001 (Environmental Management Systems) — Reduces regulatory and reputational risk for brands selling in stricter markets (EU, UK, Australia).
SA8000 / BSCI / WRAP / SEDEX (SMETA) — Social compliance frameworks that retailers often require. Non-compliance can trigger audit failures, shipment holds, or forced re-sourcing.
GOTS / OEKO-TEX Standard 100 — Organic and chemical safety certifications that reduce testing uncertainty and improve buyer acceptance in regulated markets.
Zero Liquid Discharge (ZLD) infrastructure — Tirupur is widely recognized for ZLD investment and large-scale effluent treatment, which reduces disruption risk from environmental regulatory actions and supports buyer sustainability expectations.
Always include a “Compliance & Testing” line and a “Risk Contingency” line in your calculator. Even with conservative estimates, these prevent underestimating non-compliance costs.
Frequently Asked Questions
Is direct-factory sourcing always cheaper than using an agent? Not on the first quote. If your agent is genuinely commission-only (3–7%) and adds strong QA and process discipline, the immediate price gap may be modest. The larger benefit shows up in TCO: fewer surprise charges, faster approvals, and better cost transparency — especially when you model hidden costs directly into the calculator.
Where does the “up to 40% savings” claim come from? The upper range is most realistic when brands currently source through trading companies with markups in the 15–40% band, plus frequent hidden costs. If your current setup is a lean commission-only agent, savings are smaller but still meaningful when you quantify hidden costs and quality risk.
What costs should I include to calculate true landed cost? At minimum: FOB + freight + documentation + testing/compliance + bank/transfer fees. Freight breakdowns vary by lane and mode. Configure your calculator to accept these by shipment or per unit.
How do I estimate labor and overhead fairly across suppliers? Use standard costing logic with SAM (Standard Allowed Minute) and minute cost concepts. Keep the tech pack constant across all quotes and avoid changing fabric specs between supplier comparisons.
Won’t direct factories force higher MOQs than agents? MOQs depend on fabric availability, dyeing lot minimums, and efficiency targets. Negotiate MOQ by fabric family (stock shades versus custom dye) and phase volumes through pilot orders. Rudraa Exports accommodates flexible MOQs through Tirupur’s cluster ecosystem.
Are payment terms better with agents or direct factories? Agents sometimes offer simplified consolidation or credit terms, but direct factories support standard export payment structures (TT, LC, staged payments). The key is modeling finance and bank fees explicitly in your calculator.
How do I protect quality without an agent on the ground? Build quality control into the process: pre-production sample sign-off, inline checks, AQL final inspection, and clear defect taxonomy. Established direct-factory partners like Rudraa Exports operate under internationally recognized compliance certifications and integrate QC throughout production, not just at final inspection.
What lead time should I expect from Tirupur for knitwear? Integrated Tirupur supply chains often deliver in approximately 20–30 days FOB lead time for repeat orders, depending on product complexity and capacity. Use the calculator to translate lead time into working-capital exposure and missed sales risk for seasonal categories.
Why do some brands still use trading companies despite higher costs? Convenience — bundled services, consolidation, and a single point of contact. The trade-off is reduced cost visibility and higher markups (15–40%). Some brands run a hybrid model: direct-factory for core programs, intermediaries for special one-off buys.
How should I negotiate pricing once I have calculator results? Negotiate drivers, not just final numbers:
- Lock fabric specifications and GSM first (biggest variable)
- Demand line-item packaging and testing costs upfront
- Clarify whether your intermediary is commission-based or markup-based
- Propose volume commitments in exchange for margin reduction
What’s the typical T-shirt manufacturing cost in India? Tirupur FOB pricing for cotton T-shirts ranges from $1.50 to $4.00 per piece depending on fabric weight (160–200 GSM), print method, trim complexity, and order volume. Industry-wide Indian T-shirt FOB has trended toward $2.32 in recent benchmark data.
What’s the typical hoodie manufacturing cost in India? Indian hoodie FOB pricing typically ranges from $8 to $18 per piece depending on GSM (280–400+ GSM common), trim quality, embroidery or print complexity, and order volume.
Next Steps: Run the Calculator, Then Request a Direct-Factory Quote
If your current garment sourcing is agent-led or routed through a trading company, the fastest way to unlock margin is to quantify the difference with a consistent cost model.
Action plan:
- Run the sourcing cost calculator with your real annual units, current commission or markup assumptions, and typical hidden-cost pattern (sampling, testing, packaging, bank fees, rework).
- Export the scenario output showing FOB vs landed cost vs TCO.
- Request a custom direct-factory quote from Tirupur based on your tech pack and target FOB.
- Compare against your current model using the same TCO assumptions for an apples-to-apples view.
When the calculator reveals a large structural gap — particularly versus trading markups in the 15–40% band — switching to a transparent direct-factory model can deliver up to 40% savings across the right programs.
Why Rudraa Exports for Direct-Factory Garment Sourcing in Tirupur
Rudraa Exports operates as a transparent direct-factory partner inside Tirupur’s mature export ecosystem. Brands switching from agent or trading-company sourcing to Rudraa Exports gain:
- Line-item cost transparency across fabric, trims, value-add, testing, and packaging
- No embedded markups — agreed margin on top of true factory cost
- Pre-agreed TCO controls that prevent late-stage cost creep
- Mature export operations with documentation discipline for EU, US, Australia, and Middle East buyers
- Multi-port shipping flexibility through Tuticorin, Chennai, and Cochin
- Integrated quality assurance throughout production, not just final inspection
- Compliance documentation aligned with major international certifications
- FTA-eligible certification of origin for buyers in India’s expanding free trade agreement markets
Rudraa Exports is particularly well-suited for fashion brands running multi-style programs, private-label retailers managing tight margins, importers diversifying away from China, and corporate uniform programs requiring transparent, repeatable cost models.
Conclusion: Better Sourcing Decisions Start with a Better Cost Model
Fashion sourcing has moved beyond “Who can quote the lowest FOB this week?” Industry analysis from McKinsey and others increasingly emphasizes resilience, transparency, and stronger supplier relationships as volatility persists through 2026.
In practical terms, that means your sourcing team needs a repeatable way to quantify true cost — not just unit price. The Sourcing Cost Calculator framework in this guide compares direct-factory garment sourcing against agent-based and trading-company structures using:
- Tirupur T-shirt benchmarks ($1.50–$4.00) and India hoodie benchmarks ($8–$18) as sanity checks
- Intermediary fee ranges (agents 3–7%, trading 15–40%)
- Hidden cost categories (sampling, testing, packaging, freight, rework, bank fees)
Layering these together converts emotional price negotiation into measurable ROI.
Run your real numbers, pressure-test with optimistic and realistic presets, and use the output to decide whether direct-factory sourcing in Tirupur fits your margin and supply-chain goals. When the calculator reveals a structural markup problem or repeat hidden costs, your ROI case writes itself.
Related guides: the typical manufacturer payment terms, how to source from Tirupur, and our India vs China manufacturing comparison.
Ready to test direct-factory sourcing with a transparent quote? Visit rudraaexports.com, share your tech pack and annual volumes, and receive a line-item FOB quote you can compare directly against your current model.